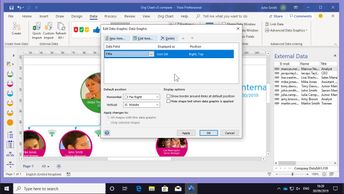
Visio allows learners to illustrate documents with a series of drawing tools. This 9-video course, recorded in a Visio Online Plan 2 environment, explores Visio tools that allow you to illustrate your documents by inserting data fields, callouts, images, links, and objects which add useful information to a file. First, observe how to double-click on the shape you want to add a field toâor click on the Field Tool and select the shape and insert the category for your field from the left-hand menu: Shape Data, Date, Time. Other key topics explored in this course include how to use the Edit Data Graphic window, which displays information about the data graphic selected, and how to create a data graphic by using the Advanced Data Graphics tool and selecting New item when the Create New Data Graphic window opens. Observe how to choose the Data field, and click on that drop-down menu button. Finally, learn how to annotate a document to add information quickly, and how to import and manage external data in a file.
| Objectives |
|---|
Visio Professional 2019: illustrating & Enhancing Documents
|


